finally getting a new comp(w00t!!), the first since building this one for RBR before the release.. hopefully now I can play RBR without crashes(Hint: build comp for favored game AFTER finding out what hardware works with it....), and can work on some of these data sets .. (the glenhelen dem took half a day to be generated on this old comp, and thats tiny compared to what I want to do.)
2Tb storage, 6Gb ram,5770, i7 920 .. can't wait!!
hopefully I will be posting some updates soon!
Thursday, December 3, 2009
Sunday, November 8, 2009
Loma Linda complex
View Larger Map
canyon road and whatever else is covered with good points, the stadium trucks could have fun 'round here.
Saturday, April 18, 2009
hmmm.. Gotta find my notes..

I was working on some Phil Mills pacenotes for BTB way back around 4.2.2 .... now I've gone and lost my paper notes on what the last note was supposed to be .. hmm..
anyhow, this is what I had done just before 4.2.2 was released with the new flat left, and flat right notes included. Unf I didn't make the last 2 icons before they vanished in newer versions. (now, where did I put that notebook?!)
I know flat left was '6' ...
Wednesday, March 25, 2009
Wednesday, March 18, 2009
Thursday, February 26, 2009
Mt Hamilton Rd CA - rt130


View Larger Map
The sinuous 19-mile (30 km) Mt. Hamilton Road (part of State Route 130) is popular with bicyclists and motorcyclists. Built in 1875–76 in anticipation of the observatory, and the need to carry materials and equipment up the mountain in horse-drawn wagons, the grade seldom exceeds 6.5 percent. The road rises over 4,000 ft (1,200 m) in three long climbs from San Jose to the mountain top. Length is 19 miles (31 km) from the Alum Rock Road junction. The upward trek is interrupted by two descents, first into Grant Ranch County Park, and again to cross Smith Creek.
The road is advertised to include 365 curves, one for each day of the year. This is true, subject to definition of the term "curve." If the yellow line bends to the right, then straightens out, then bends to the right again, it is regarded as one curve. If the yellow line describes an ess, on the other hand, it counts as two curves, regardless of how gentle the ess may be.
---------------------------------
Sounds Like fun. Think I'll do this one as my first real LIDAR test stage .. still gotta make a DEM though.Also, I'm only planning on working on the section from smith creek to the summit, due to tree cover - I expect much better data for this segment of the road (and its easier and faster to run with less trees =)
Wednesday, February 25, 2009
Free DEM sources and LIDAR data
The OpenTopography Portal
NCALM LIDAR Data Distribution
CLICK lidar point cloud data
http://seamless.usgs.gov/index.php
http://www.pasda.psu.edu/
Mt. Saint Helens Lidar
Puget Sound LIDAR Consortium
NCALM LIDAR Data Distribution
CLICK lidar point cloud data
http://seamless.usgs.gov/index.php
http://www.pasda.psu.edu/
Mt. Saint Helens Lidar
Puget Sound LIDAR Consortium
Connecticut LiDAR-based Digital Elevation Data


Wednesday, February 18, 2009
Data and stuff for a script test
well, I've been asked for some data to test .. so here is what I've got on this particular small test project I was working on with that 16bit grayscale script:
first off, there are a few programs worth playing with with this sort of data(LIDAR), its been a while but here's what I think I was using to generate/view/translate the original point data that I received..
Depending on how many trees are in your data, you may have to do so other pre-processing on your point data to get as good a bare earth set of points as possible - that's done with another program .. I've been working with some desert point data so I don't have to worry about that with this data set...
quikgrid; to process the bare earth point data into a surfer .grd - This can take a LONG time if you generate a very detailed grid, and you will have to fiddle with settings depending on your point density/trees, so on sparser point data expect to have to regenerate several times before you get a decent .grd - so set aside a weekend and/or work on small segments at a time - I didn't, even though in stage miles this is a very short bit of road, It still took ages for the 20cm and 30cm tests - Patience, and a Fast computer will both do you good:
http://www.perspectiveedge.com/
landserf 2.3 - now you load that .grd so you can generate the shaded releif you will later use as a background in BTB so you can see where to place track and terrain nodes, also take the opportunity to transfer to a format thats easily readable by scripts and other GIS software .. I've been using arc.asc AKA 'ArcGIS text raster' in the landserf save box
Landserf 2.3 dl:
https://sharepoint.ngdc.wvu.edu/sites/digital_soils/DSM%20Tools/Shareware%20and%20Open%20Source%20Software/landserf230WindowsInstall.jar
Site:
http://www.landserf.org/
now of course is the BTB work, load up that shaded relief as a background, remember your grid corners from quickgrid, and edit the .xml of your BTB save to get the background in the right place..
lay down your track, cross-sections and terrain nodes at appropriate locations on the shaded relief ..
and hope that we can get a script to work!
I would also like such a script to affect surface cross-sections, as this would save much time, cause the generated grids are not perfect, since so much of it is interpolated, it would give a massive head start on the inevitable manual fine tuning.
------------------------------------
Images and data to follow...
First off, here is a 3d view of a grid I generated from LIDAR, this is the data that we are looking at today.
the location is a road just off of a major fault line in California, heading up into the mountains.
Cloudland Truck Trail:
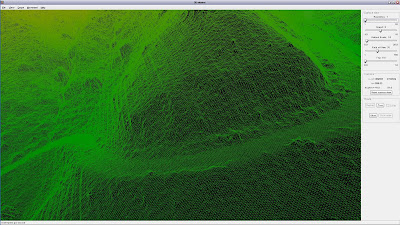
note that I couldn't get the view level in the 3d view, its not that steep =)
here is a shaded relief of the whole dataset just to give you a idea of the area we are looking at:
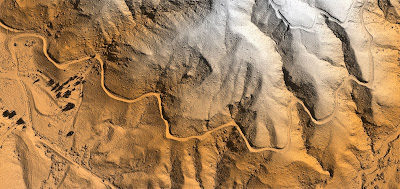
OK, got the zip of the shaded relief, the BTB test track to be modified, and the .asc gridfile, 20cm resolution uploaded:
DEM, Track, Background
if anyone can get a script working, I'll regenerate the DEM to try and minimize the point data artifacts ... (the graining)
And here is the point data that I generated this DEM from:
Point Data 6018
Subscribe to:
Posts (Atom)
